

Web applications · Dashboards · Data pipelines
Turn raw data into tools people use.
Onrush Data designs and builds interactive dashboards, maps and the pipelines behind them, so the numbers that matter are current, traceable and easy to act on.


Services
From source data to a finished interface.
-
Dashboards
Interactive views of an organization's data, designed to be read quickly and to support a decision.
-
Data pipelines
Scheduled collection, validation and joining of source data, so every figure shown is current and traceable to its origin.
-
Web applications
Maintainable front ends and small services on managed infrastructure, with low running costs and no servers to babysit.
Selected work
Public demonstrations, built on open data.
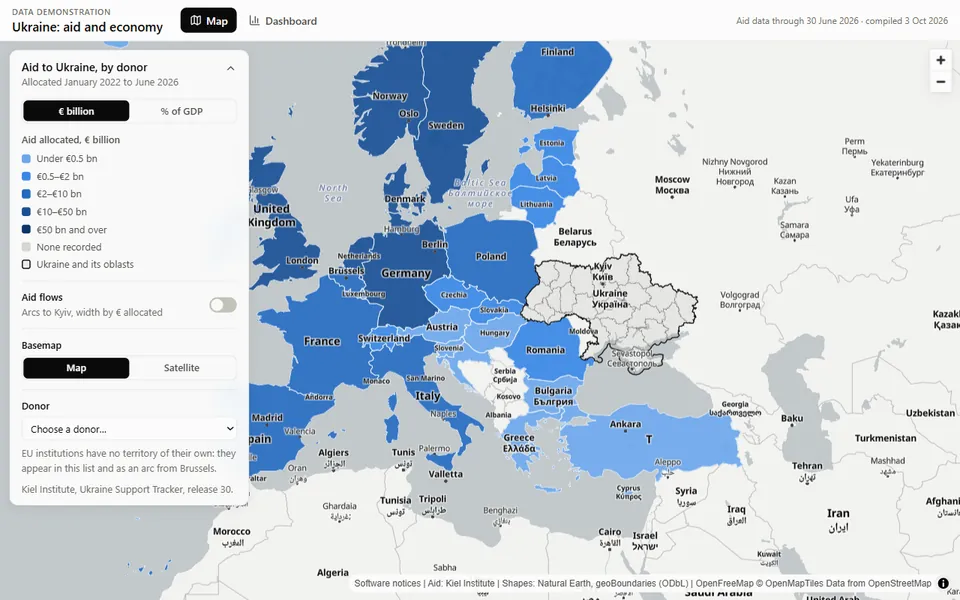
Ukraine: aid and economy
International aid to Ukraine by donor, shown on a map with aid flows and in a summary dashboard, with every source cited.
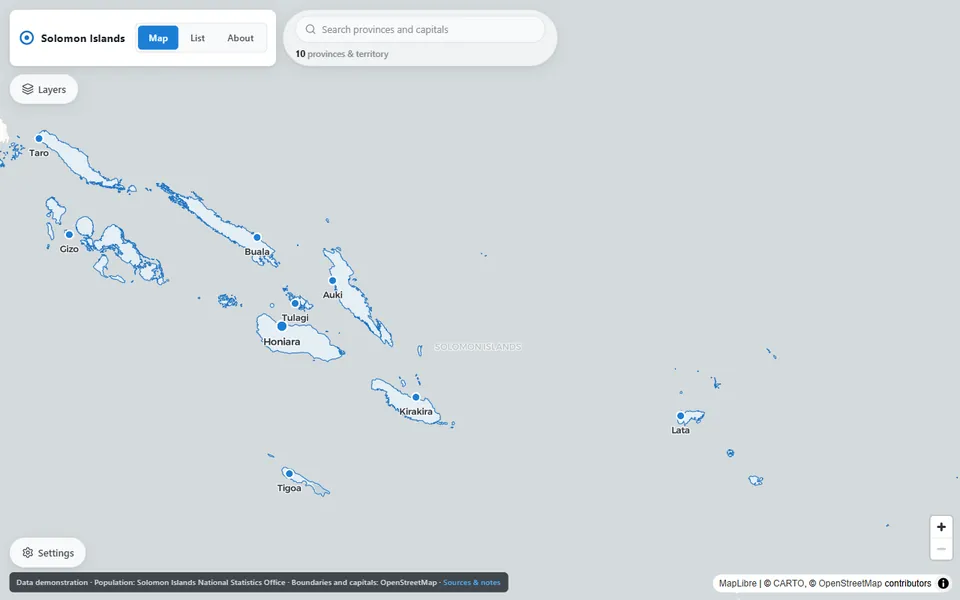
Solomon Islands provinces
The nine provinces and the Capital Territory on a map of the country, with capitals, search, and census population for 1999, 2009 and 2019.
Approach
Small, deliberate steps to something that works.
-
01
Scope
Agree on the question the tool must answer, the sources it will draw on, and what finished looks like.
-
02
Build
Deliver the pipeline and the interface in working increments that can be reviewed and used along the way.
-
03
Hand over
Document how the data flows and how to update it, on infrastructure the client controls, with ongoing support available.
Have data that should be doing more?
Describe the problem in a few lines, and the data there is to work with.